120+ customers since 2009




Integrated with


At your volume
What it means for you
$10 million$5 billion
Example calculation with 0.6 to 1.0 percentage points more profit on revenue, in markets with a starting profit of around 0.8 %. The effect depends on products, markets and current pricing and is not a promised result.
+0.6 to +1.0 percentage points$1,500,000 – $2,500,000more profit per year
The scenarios explained
Where profit is lost, scenario by scenario
One coin, five customers. Each of them pays what fits.
With a fixed markup every customer pays the same. Switch on price differentiation, lever by lever, and see how prices, profit and sales change for each customer, and what it adds up to.

Differentiate prices by
| Customer | Price | Markup | Coins a month | Profit a month |
|---|
- Coins a month
- Average markup
- Profit a month
- Gain vs. one price
The Margin Optimization Platform sets a price per customer segment, location, order size and time of day, by rules the dealer defines, and keeps every one of them up to date with the spot price.
Why different customers pay different markupsPrice differentiation, lever by lever, and the studies behind it
- One price leaves money on the table
With one price a dealer chooses between customers who would pay more and customers who only buy for less. Selling to groups of customers at different prices is what economists call third-degree price discrimination; nearly all firms with market power use some form of it [1].
- What the coin costs in the market
The Perth Mint strikes at most 500,000 of the 2026 1 oz Kookaburra [2]. It sells from about 11.6 % over spot at the cheapest of nine dealers compared [3]; one dealer asks 4 % more when paid by card than by bank transfer [4]. So dealers buy it below 11.6 % over spot, and earn a few percent on it.
- Customer segment: collectors
A collector of animal-motif series such as the Kookaburra buys the 2026 coin to complete the series, not for the ounce, and compares less on price. What collectors pay shows in the series: the same 1 oz Kookaburra of 2018 is offered at $106.44 [5], the 2026 coin from about 11.6 % over spot [3]. Special editions of the 2026 1 oz coin are limited to 2,500 and 3,000 pieces [6, 7].
- Location
Prices are lower where a competitor is close: the Australian competition authority found supermarkets with a rival within one kilometre 1.36 % cheaper [8]. Retail chains set prices by the competition in each local market [9]. A store with no other dealer nearby can ask more.
- Order volume
Large buyers compare quotes and switch dealers; a quantity discount wins orders that would otherwise go elsewhere [10]. One dealer sells the 1 oz Kookaburra 1.9 % cheaper per coin from 20 coins and 2.8 % cheaper from 300 [4]. The profit per coin falls, the total profit rises with the volume.
- Time of day
People buy differently at different times. A study of in-store purchases and online food delivery found price sensitivity falling by about 0.5 % per hour over the day: morning buyers hunt for deals, evening buyers switch less [11]. Shoppers judge the same online promotion differently in the morning and in the evening [12], and online retailers already change their prices at different times of day [13]. The investor at 10:00 on a weekday compares every offer; the buyer browsing on Sunday evening compares less.
- How the example calculates
The cost is the coin's silver value at today's spot plus a supplier premium. With one price every customer pays on cost, about 11.8 % over spot as in the market. Collectors pay 8 %, the small-town store 1.4 points more than the base, the business customer 1 %, Sunday evening 1 point more. The coins customers buy change with an assumed price sensitivity, low for collectors, very high for business customers who compare quotes. Illustrative figures.
- Varian, H. R. (1989): Price Discrimination. Handbook of Industrial Organization, vol. 1, ch. 10
- BullionStar: Australian Kookaburra 1 oz silver 2026, limited mintage of 500,000
- Bullion Hunters: Perth Mint Kookaburra silver coins, dealer prices compared (27.10.2026)
- Hero Bullion: 2026 1 oz Australian Kookaburra, prices by quantity and payment
- APMEX: 2018 Australia 1 oz Silver Kookaburra BU (27.10.2026)
- The Perth Mint: Perth Stamp and Coin Show Special Kookaburra 2026 1 oz, gold-plated
- APMEX: 2026 1 oz silver colorized Kookaburra (World Money Fair)
- Australian Senate, Economics Committee (2009), citing the ACCC grocery inquiry 2008
- Li, Y., Gordon, B. R. and Netzer, O. (2018): An Empirical Study of National vs. Local Pricing by Chain Stores Under Competition. Marketing Science
- Dolan, R. J. (1987): Quantity Discounts: Managerial Issues and Research Opportunities. Marketing Science 6(1)
- Zhang, S. et al. (2024): Does time of day affect consumers' price sensitivity? Humanities and Social Sciences Communications 11
- Morning deals make me feel smart: Consumer evaluations of online sales promotions differ by time of day (2023). Journal of Retailing and Consumer Services
- MacKay, A. and Weinstein, S. (2022): Dynamic Pricing Algorithms, Consumer Harm, and Regulatory Response. Washington University Law Review 100
The supplier changed the price. The sales price did not.
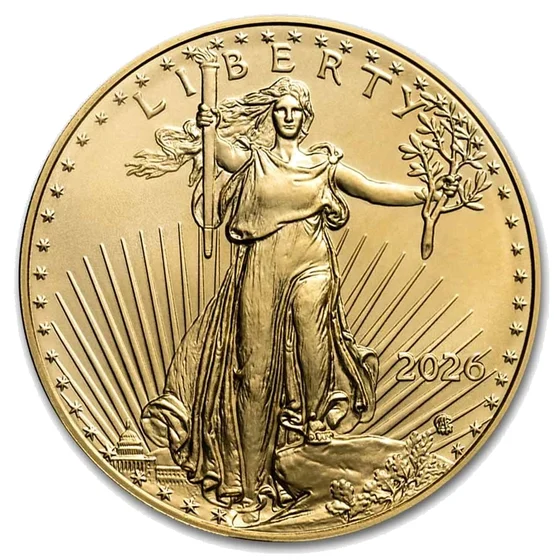
The supplier raises its markup on the American Eagle a little, from to . The dealer's system still calculates with . The shop price stays where it was, and the difference comes out of the profit on every coin.
Gold spot per ozSupplier's spot?
+ Supplier markup Raised by the supplier
= Cost
Shop price
Profit per coin
With the Margin Optimization Platform the shop price follows the new markup to , and the profit stays .
Precious metals can be very volatile. Protect yourself.
At the end of January 2026 gold set a record and then had its most volatile day ever. Updating prices every 10 minutes is insufficient. In those ten minutes gold can move more than the profit on a coin. Updating them more often will annoy customers.
Volatility threshold: . Response:
| Ten minutes on a volatile day | No protection | With the platform |
|---|---|---|
| Shop price | ||
| Gold The platform detects volatility | – | |
| A customer orders coins | the price from 10:00 | |
| The supplier charges | ||
| Profit per coin |
The Margin Optimization Platform detects volatility. The volatility threshold and the response are set per dealer: pause trading, widen the bid–ask spread or update prices more often.
A bar in the vault costs money every day it does not sell.
The profit comes once, when the bar sells. Until then it ties up capital, needs a vault, and the same money could be earning a profit in products that sell fast. Set these costs to match the business and see after how long a slow bar has eaten its profit.
Costs of inventory
Costs are rates per year, charged for the time the bar is in stock.
| Sold after | Holding cost | Profit left |
|---|
Loss from
The Margin Optimization Platform reads the inventory and sees how fast each product sells. Slow movers are priced to sell within the rules set by the dealer, so stock stays low and the profit is earned before holding costs eat it.
How holding costs add upFinancing, vault, opportunity cost and the sources behind the defaults
- The profit comes once
A bar earns its profit on the day it sells. Every day before, it costs: the money tied up in it, the vault it lies in, and the profit that money could earn elsewhere. Each cost is a rate per year; the table charges it for the days the bar is in stock, cost × rate × days ÷ 365.
- Liquidity provider financing
Dealers finance their stock through their liquidity provider, often with metal: on consignment or as a lease, the dealer holds the provider's metal and pays a fee on its value. Providers such as StoneX offer consignment accounts and metal leases [1] but publish no rates. Such fees are a market rate for lending metal plus the provider's markup [2]. Gold lent to jewellery manufacturers and refiners earned its lenders a year in June 2026 [3]. With a markup of points, an assumption, the default is a year. A dealer who pays with its own money pays no fee, but the money then has an opportunity cost.
- Vault storage
Professional vaults charge a share of the metal's value per year. BullionVault charges a year on gold, insurance included [4]; Goldmoney charges 0.25 % a year at all its vaults [5].
- Opportunity cost
Money in a bar that does not sell cannot buy products that do. A-Mark, one of the largest precious metals traders in the US, earned a gross profit of of its revenue in the year to June 2025 and turned its stock times [6]; turnover is cost of sales divided by average stock [7]. So every dollar of stock earned about in gross profit that year: ÷ (100 % − ) × .
- Financing and opportunity cost overlap
The financing fee is paid on every bar in stock, also on bars that sell fast. If the money would otherwise go into faster products, the slow bar costs above all the profit forgone; set the financing to zero to count only that.
- How the example calculates
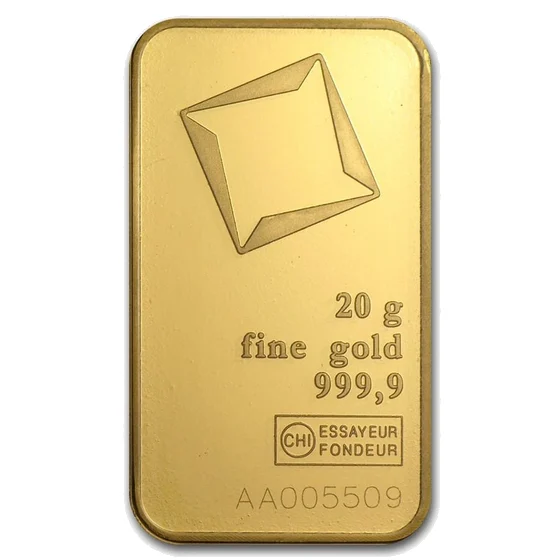
The bar costs the gold value of 20 g at today's spot plus and sells at spot plus , within the 2.0 to 2.3 % over spot that dealers ask for this bar [8]. The purchase premium is illustrative.
- StoneX: Precious metals services, financing, consignment accounts and leases
- Consignment agreement between bullion banks and a jewellery manufacturer (2003): fee = market rate for precious metals maturities plus a surcharge set by the bank
- Monetary Metals: weighted average yield of 3.96 % a year on gold leased to the precious metals industry, press release 16.06.2026
- BullionVault: Tariff, custody charges including insurance (2026)
- Goldmoney: Our Fees Explained, last updated 1 February 2026
- A-Mark Precious Metals: Form 10-K for the fiscal year ended 30 June 2025
- A-Mark Precious Metals: Form 10-Q for the quarter ended 31 March 2025, definition of inventory turnover
- findbullionprices: Valcambi 20 gram gold bar, premium history 2026
Supplier and dealer price on different spot prices
Gold has no single spot price. Every data provider builds its own from the quotes of its banks, at its own moment. The supplier invoices on one provider. The dealer rebuilds the supplier's price on another. The gap costs profit on every ounce sold.
The supplier invoicesSpot from data provider A
Gold spot per oz
+ Supplier conditions 0.8 %
Purchase price
The dealer rebuilds itSpot from data provider B
Gold spot per oz
+ Supplier conditions 0.8 %Up to date?
Calculated cost
+ Profit 0.5 %
Shop price
- Spot gap per oz
- Planned profit
- Actual profit
With the Margin Optimization Platform prices are calculated on the same spot as the supplier's. The calculated cost is the invoice. Illustrative figures.
Why rebuilding the supplier's spot goes wrongHow spot prices are made, and where two of them part
-
There is no single spot price
Gold and silver trade mostly over the counter in London, directly between two parties and not on an exchange [1]. What was traded at which price is not published [2]. The only fixed reference is the LBMA Gold Price, set in an auction twice a day, at 10:30 and 15:00 London time [3]. Between those auctions, "spot" is whatever a data provider shows.
-
Every data provider builds its own
Bullion banks quote prices to buy and to sell, and each data provider combines the quotes of its own set of banks into one figure [2]. So two providers differ:
- Other banks. Each provider takes the quotes of different banks.
- Another moment. Providers update at different speeds; in fast markets the screens of banks can lag behind [2].
- Bid, ask or mid. One shows the price to sell, another the price to buy or the middle of both [4].
- Spot or futures. Some prices come from the futures market, not from spot trading [4].
-
A second currency adds a second source
If the supplier invoices in another currency than the one in which a spot price is quoted, the exchange rate comes from a source and a moment of its own as well. Even the European Central Bank's reference rates are set once a day and, as the ECB says, are not meant for transactions [5]. Equal spot prices in dollars can still give different prices in euros.
-
What it costs, and what the platform does
The supplier invoices on the spot of its provider, at the moment it books the order. A dealer who calculates costs on another provider's spot, or on an older tick of the same one, has costs in the system that are not the invoice. The gap is small, often 0.1 to 0.3 %, but it lands on every ounce, and when the calculation is too low the dealer sells below the planned profit. The Margin Optimization Platform calculates on the same spot, from the same source and at the same moment as the supplier, so the calculated cost is the invoice.
The dollar moves all day. The system rate moves once.
The supplier invoices the Lunar Goat in US dollars. The dealer sells it in euros. The system converts at yesterday's reference rate, while the dollar keeps moving. When it rises, the cost in euros rises and the shop price does not.

Shop price , converted at yesterday's rate of euro per dollar.
| Today | EUR per USD | Cost | Profit per coin |
|---|
The Margin Optimization Platform converts every price at the live rate, so the shop price follows the dollar during the day.
Why a daily rate is too slowReference rates, daily moves and how the example calculates
- A reference rate, once a day
Many systems convert at a reference rate that is set once a day. Such rates exist for every major currency pair. The WM/Reuters closing spot rates, fixed at 4 pm London time, are the market's common benchmark for valuations [1]. Central banks publish rates of their own: the European Central Bank for the euro, set around 14:10 and published around 16:00 CET [2], and the Bank of England for sterling [3]. Each shows the market at one moment of the day. The ECB publishes its rates for information only and discourages their use for transactions [2]; the Bank of England calls its rates no more authoritative than any commercial bank's [3]. The example uses the euro; the same holds for any two currencies.
- The dollar moves every hour
EUR/USD moves by about 0.5 % from its low to its high on an average day in 2026, more in busy weeks [4]. A price converted yesterday at 16:00 is still on yesterday's rate the next afternoon.
- What a move costs
The profit on a gold coin is a few tenths of a percent of its value. A move of the dollar by the same few tenths takes all of it: the supplier invoices in dollars, so the cost in euros rises with every cent the dollar gains.
- How the example calculates
The supplier invoices the coin at today's gold spot plus . The shop price is that cost in euros at yesterday's rate plus of spot, as in the chart above. The dollar's path through the day is illustrative, a little above an average day. All prices from today's gold spot and euro rate on this site.
- LSEG: WMR closing spot rate benchmarks (4 pm UK time) designated critical benchmarks, 2024
- European Central Bank: Euro foreign exchange reference rates, published around 16:00 CET, for information purposes only
- Bank of England: Exchange rates, daily spot rates, not official rates
- TradeThatSwing: EUR/USD daily volatility, average daily range 2026
Customers compare prices. The calculation should too.
Move the purchase cost and the price of a 1 kg silver bar and see where the dealer stands against three other shops, how many bars sell and what they earn.
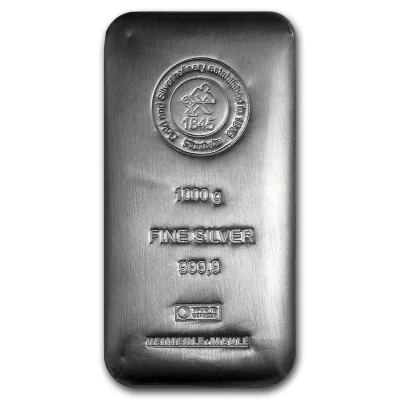
- Placement
- Bars sold a month
- Profit a month
- Missed out a month
We help capture competitors' prices and connect them to the Margin Optimization Platform. The calculation then knows where the price stands, and the price takes the position the dealer chooses.
How the model calculatesPrices, bars sold, profit and the studies behind them
-
Prices
Every price starts from today's silver spot, the same source as all prices on this site. A 1 kg bar holds troy ounces, so its spot value is . The three other shops ask spot plus ; dealers ask from about 3 % over spot for a 1 kg bar, on average about 7 % [7]. What the shops pay their suppliers is not known. The dealer's own purchase cost is the black point on the range, by default a bar at today's spot, that is spot plus , an example. The price starts between shop A and B. For comparison: A-Mark, one of the largest precious metals traders, reports a gross profit of 1.9 % of revenue across its whole business for 2025 [1]. With a good purchase cost the dealer can be the cheapest and still earn. With a higher one, the cheapest place sells at a loss and the best price sits higher, with fewer bars: nobody can always be the cheapest. At the default purchase cost the best price is , . The price can be set from spot plus to spot plus .
-
Bars sold
Buyers compare the four shops as on a price comparison site. Each buyer picks one shop or does not buy this month, following a multinomial logit, the standard model of choice between offers [2]. buyers a month look at this bar. Three effects measured on price comparison sites for identical products set how they choose:
- Price. Every percent above the cheapest offer costs demand. Ellison and Ellison found demand for identical computer parts on a price search site extremely price-sensitive [3]; an early version of their study estimates an elasticity of about −50 [4]. The model uses .
- The cheapest offer. A shop gets about 60 % more clicks when it has the lowest price on the site [5]. The model adds .
- Place in the list. The further down the list, the fewer clicks, with the log of clicks falling in a straight line with the rank [6]. The model takes off for each place.
-
Profit and missed out
Profit a month is the bars sold times the price less the purchase cost; below the purchase cost every bar sold is a loss. The model tries every price in the range, cent by cent, and keeps the one with the highest profit: the best price. Missed out is the profit at the best price less the profit at the price set. Being cheaper than needed costs profit on every bar; being more expensive costs bars.
-
What the model does not show
The figures are illustrative. The studies looked at computer parts and electronics; we found none that measures sales and prices for precious metals. A 1 kg bar is just as identical from shop to shop, but trust, delivery and stock also count, which is why the most expensive shop still sells a little. With a dealer's own sales and price data the model can be fitted to its market.
- A-Mark Precious Metals, Form 10-K for the year ended June 30, 2025
- McFadden, D. (1974): Conditional Logit Analysis of Qualitative Choice Behavior. In: Frontiers in Econometrics
- Ellison, G. and Ellison, S. F. (2009): Search, Obfuscation, and Price Elasticities on the Internet. Econometrica 77(2)
- Ellison, G. and Ellison, S. F. (2001): Search, Obfuscation, and Price Elasticities on the Internet, preliminary version
- Baye, M. R., Gatti, J. R. J., Kattuman, P. and Morgan, J. (2009): Clicks, Discontinuities, and Firm Demand Online. Journal of Economics & Management Strategy 18(4)
- Mizuno, T. and Watanabe, T. (2008): Statistical Analysis of Price Fluctuations in the Online Market. RIETI Discussion Paper 08-J-052
- goldsilver.ai: 1 kilo silver bar, dealer prices compared, lowest and average premium over spot (2026)
Collectors pay for rarity. Spot is only part of the price.
The system prices the 1990 Panda as metal value plus a fixed premium. Collectors do not look at spot: when an issue is sought after they pay far more, when interest fades far less. A fixed premium is wrong in both directions, for sales and for buy-back.

Metal value . The system sells at metal value + and buys back at + .
| Market |
|---|
The Margin Optimization Platform prices collector coins by demand: sales speed, stock and the market prices connected to it, not by spot alone. Sales and buy-back follow what collectors pay.
Why a fixed premium fails for collector coinsThe coin, what collectors pay and how the example calculates
- The coin
The 50 yuan Panda of 1990 was struck for the Hong Kong Expo: a gold centre of ½ oz in a silver ring of ⅕ oz, as a proof, 2,000 pieces [1]. At today's spot the metal is worth .
- What collectors pay
Collectors pay for the issue, the mintage and the condition, not for the metal. One dealer lists the coin at $4,495 [2]; a piece graded proof 69 sold at auction in May 2024 for $1,920 [3]. The price of the same coin can double or halve with demand, while spot moves by a few percent.
- Why a fixed premium fails
Metal value plus a fixed premium follows spot and nothing else. When the coin is sought after, the shop sells below what collectors pay and its stock goes too cheaply; when interest fades, the price stays above the market and nothing sells. Buy-back works the other way round: at a fixed price nobody sells to the shop when collectors get more elsewhere, and the shop pays too much when interest fades.
- How the example calculates
The coin sells for about twice its metal value, so the system sells at metal value + and buys back at + . The three situations, collectors paying + over metal value, are illustrative, as is the collectors get less when they sell elsewhere. A difference of up to 1 % of the metal value counts as at market. Gold and silver from today's spot on this site.
- Numista: 50 Yuan (Panda; Bimetallic), People's Republic of China, 1990: ½ oz gold, ⅕ oz silver, proof, mintage 2,000
- APMEX: 1990 China Gold & Silver Bi-Metallic Panda Hong Kong Expo, listed at $4,495 (seen 28.10.2026)
- Coin Varieties: China 1990 50 yuan KM-281, Stack's Bowers, May 2024, lot 33144, NGC PF69 Ultra Cameo, sold for $1,920
In the software
See how it works in the software
The scenarios as the dealer sets them up in the platform. One rule per product and case, the price is calculated from live variables.
Margin Optimization PlatformPrice rules
Margin Optimization PlatformDynamic spot price adaptation
Margin Optimization PlatformPrice rules
How it works: rules per customer groupExample 1 · Scenarios 01, 02 and 05 · the screen, the data, the calculation, step by step, with sources
- What this example shows
One product, priced differently for different customers (scenario 01); new supplier conditions reaching every price at once (scenario 02); and prices calculated on the supplier's own price, so no second spot source gets in between (scenario 05). The product is the 2026 Australian Kookaburra, 1 oz silver. First two simple rules, one per customer group, then one rule that uses everything the shop's request contains.
- Where in the platform
The price rules: one row per rule with the product, the minimum price and the sale price as formulas, the product ID in the shop, a comment, and the position of the price among competitors. A rule is opened with "Edit", changed and saved with "Edit rule". Added for this example, in blue: the field "Customer group" and the button "Add rule".
- What the platform knows
Delivered to the platform: the spot of each metal, the price of each supplier (SUPPLIER_A, SUPPLIER_B), the dealer's own stock with its purchase prices (STOCK), and the competitors' prices for the same product, captured and connected by the platform. From each request of the shop: the number of units (Units), the customer group (Group), the region (Region) and the time (Hour).
- How the price is calculated
The shop sends the platform a request for every price it needs, with the article ID and what it knows about the order. The platform finds the rule for the article, calculates its formula with the current values and returns a net price, which also goes into the XML for the shop and other channels. VAT is added by the shop. A formula is plain arithmetic over the variables, for example SUPPLIER_A * 1.03: the supplier's price plus 3 %. Functions such as PICK_CHEAPEST_SUPPLIER take over steps that need more than arithmetic.
- What the dealer sets
Per rule: the customer group, the formula for the sale price and the formula for the minimum price. On the scale under "Position" the dealer can also drag the price: the handle changes the factor in the formula, and the position, 1 for the cheapest offer, follows.
- The example, step by step
- The supplier sells the coin at spot plus 8.5 %; dealers sell it at about 9.8 to 17 % over spot [2, 3].
- Investors online pay 3 % on the supplier's price, about 11.8 % over spot. Dragged to 2 %, their price moves below Shop A, from position 2 to 1.
- Collectors, who buy the series and compare less, pay 8 %. Charging groups of customers differently is third-degree price discrimination [1].
- "Mixed sourcing", a request for 85 coins from a business customer in DE-South on Sunday at 21:00: PICK_CHEAPEST_SUPPLIER takes the cheapest source first, then the next: 35 from stock (bought at spot plus 8.0 %), 40 from supplier A (8.5 %, all it has), 10 from supplier B (8.8 %). On the average purchase price it adds +1.00 % for a business customer (volume lowers the price per unit [4]), +0.40 % for the region (prices are higher where no competitor is close [5]) and +0.20 % for the time (price sensitivity falls by about 0.5 % an hour over the day [6]).
- When supplier A raises its conditions, SUPPLIER_A changes and every rule calculates with the new price at once (scenario 02).
- The formulas calculate on the price supplier A delivers, not on a copy rebuilt from another provider's spot plus the supplier's conditions. There is no single spot: each provider builds its own from different banks at different moments [7, 8]. A rebuilt price differs from the supplier's, mostly against the dealer; with SUPPLIER_A there is nothing to rebuild (scenario 05).
- Safety nets
Every rule has a minimum price on a basis of its own, here the spot plus 9 %: if a supplier's data fail, the price does not fall below it. In "Mixed sourcing" each source has its own minimum, its purchase price plus 0.5 % (SUPPLIER_MINIMUM); the price returned stays above every one of them.
- What is illustrative
The function names, the competitors, the sources with their stock and all markups are examples. Every price is calculated from the site's spot prices; none is typed in.
- Varian, H. R. (1989): Price Discrimination. Handbook of Industrial Organization, vol. 1, ch. 10
- findbullionprices: 2026 Australia 1 oz Silver Kookaburra BU, dealer premiums compared (seen 29.10.2026)
- Bullion Hunters: Perth Mint Kookaburra silver coins, dealer prices compared (27.10.2026)
- Hero Bullion: 2026 1 oz Australian Kookaburra, prices by quantity
- Australian Senate, Economics Committee (2009), citing the ACCC grocery inquiry 2008
- Zhang, S. et al. (2024): Does time of day affect consumers' price sensitivity? Humanities and Social Sciences Communications 11
- The Perth Mint: How are spot prices determined?
- OneGold: How is spot price calculated?
How it works: rules on market movesExample 2 · Scenario 03 · the screen, the data, the calculation, step by step, with sources
- What this example shows
How the platform reacts when the market moves fast (scenario 03): rules that start on a move of the spot, not on the clock. Markets do move fast: gold reached a record of about $5,600 an ounce on 29 January 2026 and had lost about 10 % by the next day [1]. A price updated every 5 or 10 minutes can then be behind the market with every sale. The metal is gold.
- Where in the platform
The page "Dynamic spot price adaptation". As standard it changes the spot that prices are calculated on, per metal and separately for sale and purchase: by an amount, by a percentage or to a fixed price, switched on by time only (permanently, on chosen weekdays, or daily between two times). Added for this example, in blue: the activation "Market movement" with the fields for the move, "Reaction" and "Applies to", the column "Last 5 min", and the tables "Market rules" and "Adaptation log".
- What the platform knows
Delivered to the platform: the live spot of each metal, and from it the move over the last minutes. From the price rules the platform knows which prices are calculated on the spot and which are not, such as fixed prices.
- How the price is calculated
The shop sends the platform a request for every price it needs, with the article ID and what it knows about the order. The platform finds the rule for the article, calculates its formula with the current values and returns a net price, which also goes into the XML for the shop and other channels. VAT is added by the shop. The price itself comes from the price rules and their formulas. An adaptation on this page changes the spot those formulas calculate with, or changes or stops what goes out, and only while its rule is active. Without an active adaptation there is no markup here: markups belong to the price rules.
- What the dealer sets
Per rule: the metal, the move that starts it (basis points within minutes, up or down), the reaction (update more often, widen the spread, pause trading), its value, and the prices it applies to (all prices, prices based on spot, prices not based on spot). Each rule stands on its own; one move can start several. A rule ends by itself when the move falls back below its threshold.
- The example, step by step
- Two rules exist: from 30 basis points within 5 minutes the XML is updated every minute instead of every 5, for all prices; from 50 basis points trading pauses for prices not based on spot.
- The dealer adds a third: from 50 basis points the sale spot goes up by 0.50 % for prices based on spot.
- Gold rises about 1.4 % in 6 minutes. At +0.39 % in 5 minutes the updates come every minute; at +0.66 % the spread widens and the prices not based on spot pause.
- When the move fades, the rules end one after the other. The log shows every start and end with the time and the move.
- Safety nets
The reactions are the safety nets: faster updates keep prices close to the market, a wider spread is a buffer against the next move, and a pause stops prices that would not follow the move at all. Dealers do pause: gold traders in Thailand suspended online trading over a weekend in February 2026, citing the high risk of price volatility while international markets were closed [2], and APMEX stopped selling silver in January 2021 when demand surged [3]. The minimum prices of the price rules continue to apply.
- What is illustrative
The thresholds, the reactions and the move of gold are examples; 50 basis points in 5 minutes is the threshold of the scenario explanation. Spot prices come from the site's market data; none is typed in.
How it works: rules on stock turnoverExample 3 · Scenario 04 · the screen, the data, the calculation, step by step, with sources
- What this example shows
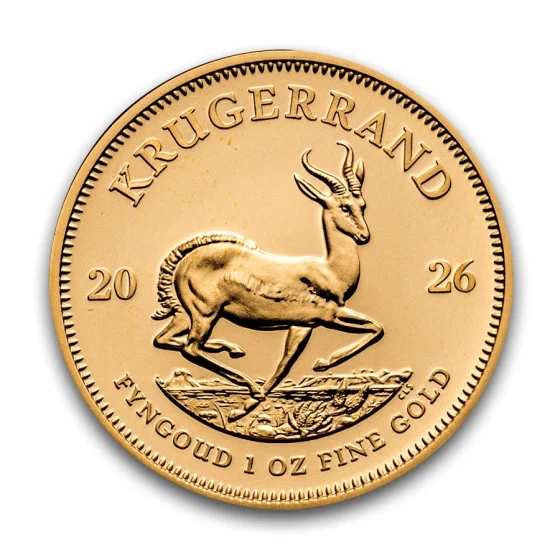
How the time a product lies in stock goes into its price (scenario 04). Every day in stock costs money; a product that sells faster than expected can carry a higher price, one that sells slower a lower one. Two products: the Krugerrand 1 oz, which sells fast, and the Valcambi 20 g gold bar, which sells slowly.
- Where in the platform
The price rules: one row per rule with the product, the minimum price and the sale price as formulas, the product ID in the shop, a comment, and the position of the price among competitors. A rule is opened with "Edit", changed and saved with "Edit rule". Added for this example, in blue: the fields "Turnover target" and "Turnover shape".
- What the platform knows
Delivered to the platform: from the stock, how many days a unit of each product takes on average until it is sold (DAYS_TO_SELL); the cost rates of holding stock, financing by the liquidity provider (LIQUIDITY), the vault (VAULT) and the opportunity cost (OPPORTUNITY); the spot and the supplier's price (SUPPLIER_A). From each request of the shop: the article ID and the number of units.
- How the price is calculated
The shop sends the platform a request for every price it needs, with the article ID and what it knows about the order. The platform finds the rule for the article, calculates its formula with the current values and returns a net price, which also goes into the XML for the shop and other channels. VAT is added by the shop. The formula here is SUPPLIER_A * (1.01 + TURNOVER(DAYS_TO_SELL; 14; LIQUIDITY + VAULT + OPPORTUNITY)): the supplier's price plus 1 %, moved by TURNOVER. That function takes the days the product sells faster or slower than the target of 14 and multiplies them by what one day in stock costs. Faster raises the markup on cost, slower lowers it.
- What the dealer sets
Per rule: the target in days, the shape and the formula. The shape says how the price follows: "Gradual", every day of difference counts and the price moves a little each day; "Steps of 7 days", only full steps of 7 days count, so the price stays the same for longer and moves in one go.
- The example, step by step
- One day in stock costs of the cost: financing a year (the gold lease yield of 3.96 % [1, 2] plus an assumed 1.5 points for the provider), the vault including insurance [3], the opportunity cost , the gross profit a dollar of stock earned at A-Mark in its last fiscal year [4]; together a year.
- Krugerrand 1 oz, gradual: sells in 5 days, 9 days faster than the target, 9 × = more.
- Valcambi 20 g bar, in steps of 7 days: sells in 24 days, 10 days slower; one full step counts, 7 × = less.
- Without a difference the markup is 1 % on cost, as for the 20 g bar in the scenario explanation, which dealers sell at 2.0 to 2.3 % over spot [5].
- Safety nets
Every rule has a minimum price on a basis of its own, here the spot plus 1 %: however slowly a product sells, its price does not fall below it. Steps keep the price stable for customers between two steps.
- What is illustrative
The function name, the target of 14 days, the steps and the days to sell are examples; the cost rates are those of the scenario explanation. Every price is calculated from the site's spot prices; none is typed in.
- Monetary Metals: weighted average yield of 3.96 % a year on gold leased to the precious metals industry, press release 16.06.2026
- Consignment agreement between bullion banks and a jewellery manufacturer (2003): fee = market rate for precious metals maturities plus a surcharge set by the bank
- BullionVault: Tariff, custody charges including insurance (2026)
- A-Mark Precious Metals: Form 10-K for the fiscal year ended 30 June 2025
- findbullionprices: Valcambi 20 gram gold bar, premium history 2026
- Year
- Product ID
- Comment
Minimum price (net)
Sale price (net)
Variables: 'Spot', 'Position_X', 'API_VariableName', 'EBP', 'SUPPLIER_A', 'SUPPLIER_B', 'STOCK', 'Units', 'Group', 'Region', 'Hour'
Price in XML
Net: , Gross:
Product ID (in shop):
Comment:
Customer & Partner Voices
How it works
The margin optimization & pricing platform behind your ERP
Channelsown and partners
- Online shop
- Branches and counter
- Buy-back
- Business customers
- Partner shops and API
Leading system
Your ERP · single point of truth for prices, orders and bookings
Margin-optimised pricesStock and orders
Platform
KTsys Margin Optimization Platform
- Data integrationAny source connects
- Price and margin optimization logicRules per channel, segment and product
- Control and logApprovals and history
Data
- Market prices
- Suppliers
- Volatility
- Competitors
- Every data source connectsMarket, stock, suppliers and competition feed into every price, continuously.
- Profit under your controlRules per channel, customer segment and product. Your trading team stays in charge.
- Buy at the best conditionsConnected suppliers support purchasing at the best conditions.
- Fitted to your businessWe implement and adapt the levers to your processes. Operation and development stay with us.
Common questions from decision-makers
Three concerns and our answers
- DependencyDoes it create a technical dependency?
The platform does not touch your existing systems or your pricing. Your ERP retrieves the calculated prices through an interface. If we part ways, that call stops: your systems need no rebuild, and your ERP returns to its own pricing.
- ContractHow flexible is the contract?
The initial term covers the setup. After that, the contract is flexible. The terms are agreed with each customer.
- CompetitionDoes the advantage last when competitors use similar solutions?
The platform does not exploit market inefficiencies that would disappear as it spreads. The extra profit comes from your own processes, for example less capital tied up in stock and direct connections to suppliers and producers that avoid slippage. It does not come at the expense of other market participants.
Getting started
One channel first
- Connect the platform to your ERPThe pricing logic passes margin-optimised prices to your ERP and receives stock and orders back.
- Start with one channelYour ERP passes the new prices to one channel first, for example the online shop. The extra profit becomes measurable.
- All channels and buy-backFurther own and partner channels follow through the ERP. Buy-back and supplier conditions complete it.
See it with your products and your conditions.
We show the platforms with your products, your prices and your channels.
Request Demo